Recent Rain and Live Creek Monitoring
The Twin Cities and Minnesota have experienced a large degree of rainfall this June, drastically changing course from droughts of 2021 and 2022. Drainage networks in the VLAWMO watershed are managed in collaboration between VLAWMO and its municipal partners.
To support these partnerships, VLAWMO maintains live remote sensors along several locations on Lambert Creek (County Ditch 14). Staff track both storm events and the rate at which water levels return to a base flow rate. For 2024, staff report that the Lambert Creek system has performed well in harnessing the influx of stormwater. Individual stormwater ponds may be experiencing higher than normal water levels, but these ponds are providing a valuable service to downstream waterbodies.
VLAWMO has remote sensors located at three flumes along Lambert Creek as well as an underground storm pipe at the Creek’s headwaters. The water level of Lambert Creek is indicative of most of the eastern portion of the VLAWMO watershed, and it has more variability and flash depending on rain and surface water runoff. The Lambert Creek subwatershed includes Vadnais Heights and parts of White Bear Township, Gem Lake, and White Bear Lake.
The north and western portion of the watershed drain into a chain of lakes that is largely channeled through the infrastructure of the Saint Paul Regional Water Services. This includes North Oaks and parts of Lino Lakes and White Bear Township. Water levels in this network can be modified by adjusting the amount of water entering the system from the Mississippi River.
Lake gages are also installed throughout the watershed and monitored by staff throughout the year. Lake gage and precipitation data help form the annual Water Monitoring Report, published each spring.
Interpreting Lambert Creek remote monitoring data:
The gage height and discharge graphs are most relevant for members of the public looking to check on creek levels. Distance and battery voltage are referenced by staff for the purpose of maintaining the sensors.
Gage Height:
The gage height is the measurement from the bottom of the flume or storm pipe to the top of the water. It is the most accurate measurement available for the current creek depths. The gage height graph shows the rise of the creek during storm events and its return back to base flow.
Discharge:
The discharge graph is a measurement of water flow going through the creek at each sensor location, measured in cubic feet per second. The discharge graphs allow us to observe the increase in creek volume during a storm event.
The “time series” icon on either graph opens up past data from any point in time since the sensor installation in 2019. Data is also downloadable.
Lambert Creek Remote Sensor links
Direct to Monitor My Watershed: Search map under "browse sites"


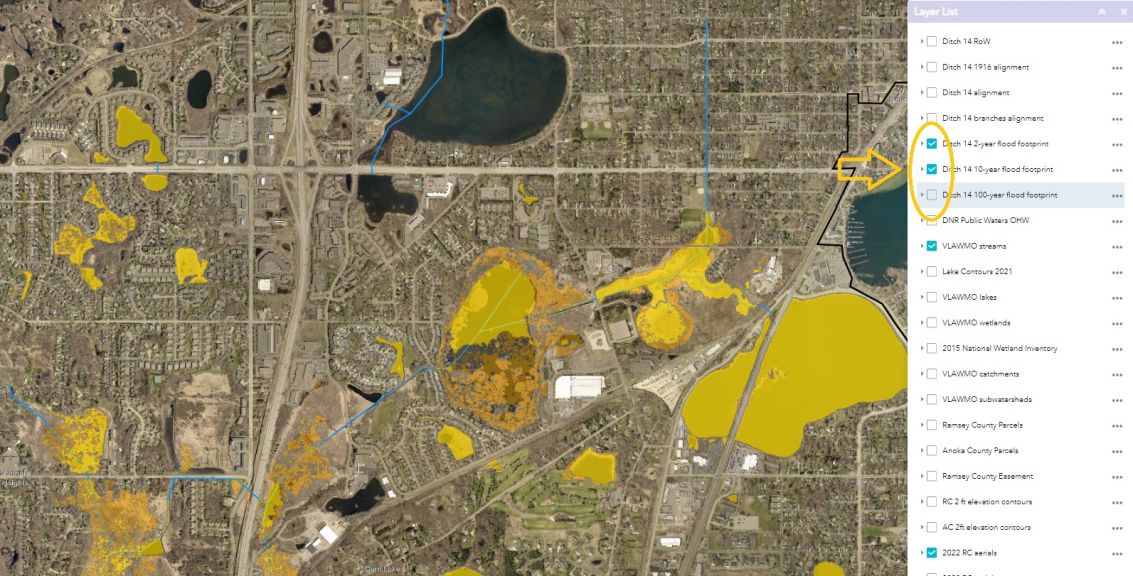
Floodplain Boundaries
VLAWMO's interactive GIS map has contains map layers for local floodplain boundaries and much more.
View floodplain data near you by clicking the "Ditch flood footprint" check boxes in the Layers List tab.
Resources:
2019 Remote Monitoring Devices blog entry
Recent Posts
Neighborhood Spotlight: Carol
Neighborhood Spotlight: Joe
VLAWMO Recruiting MN Water Stewards
Neighborhood Spotlight: Ingrid
Spring Yard Care for Water Conservation
More news
 Contact us
Phone: (651) 204-6070
Fax: (651) 204-6173
Email: office@vlawmo.org